

先上效果图
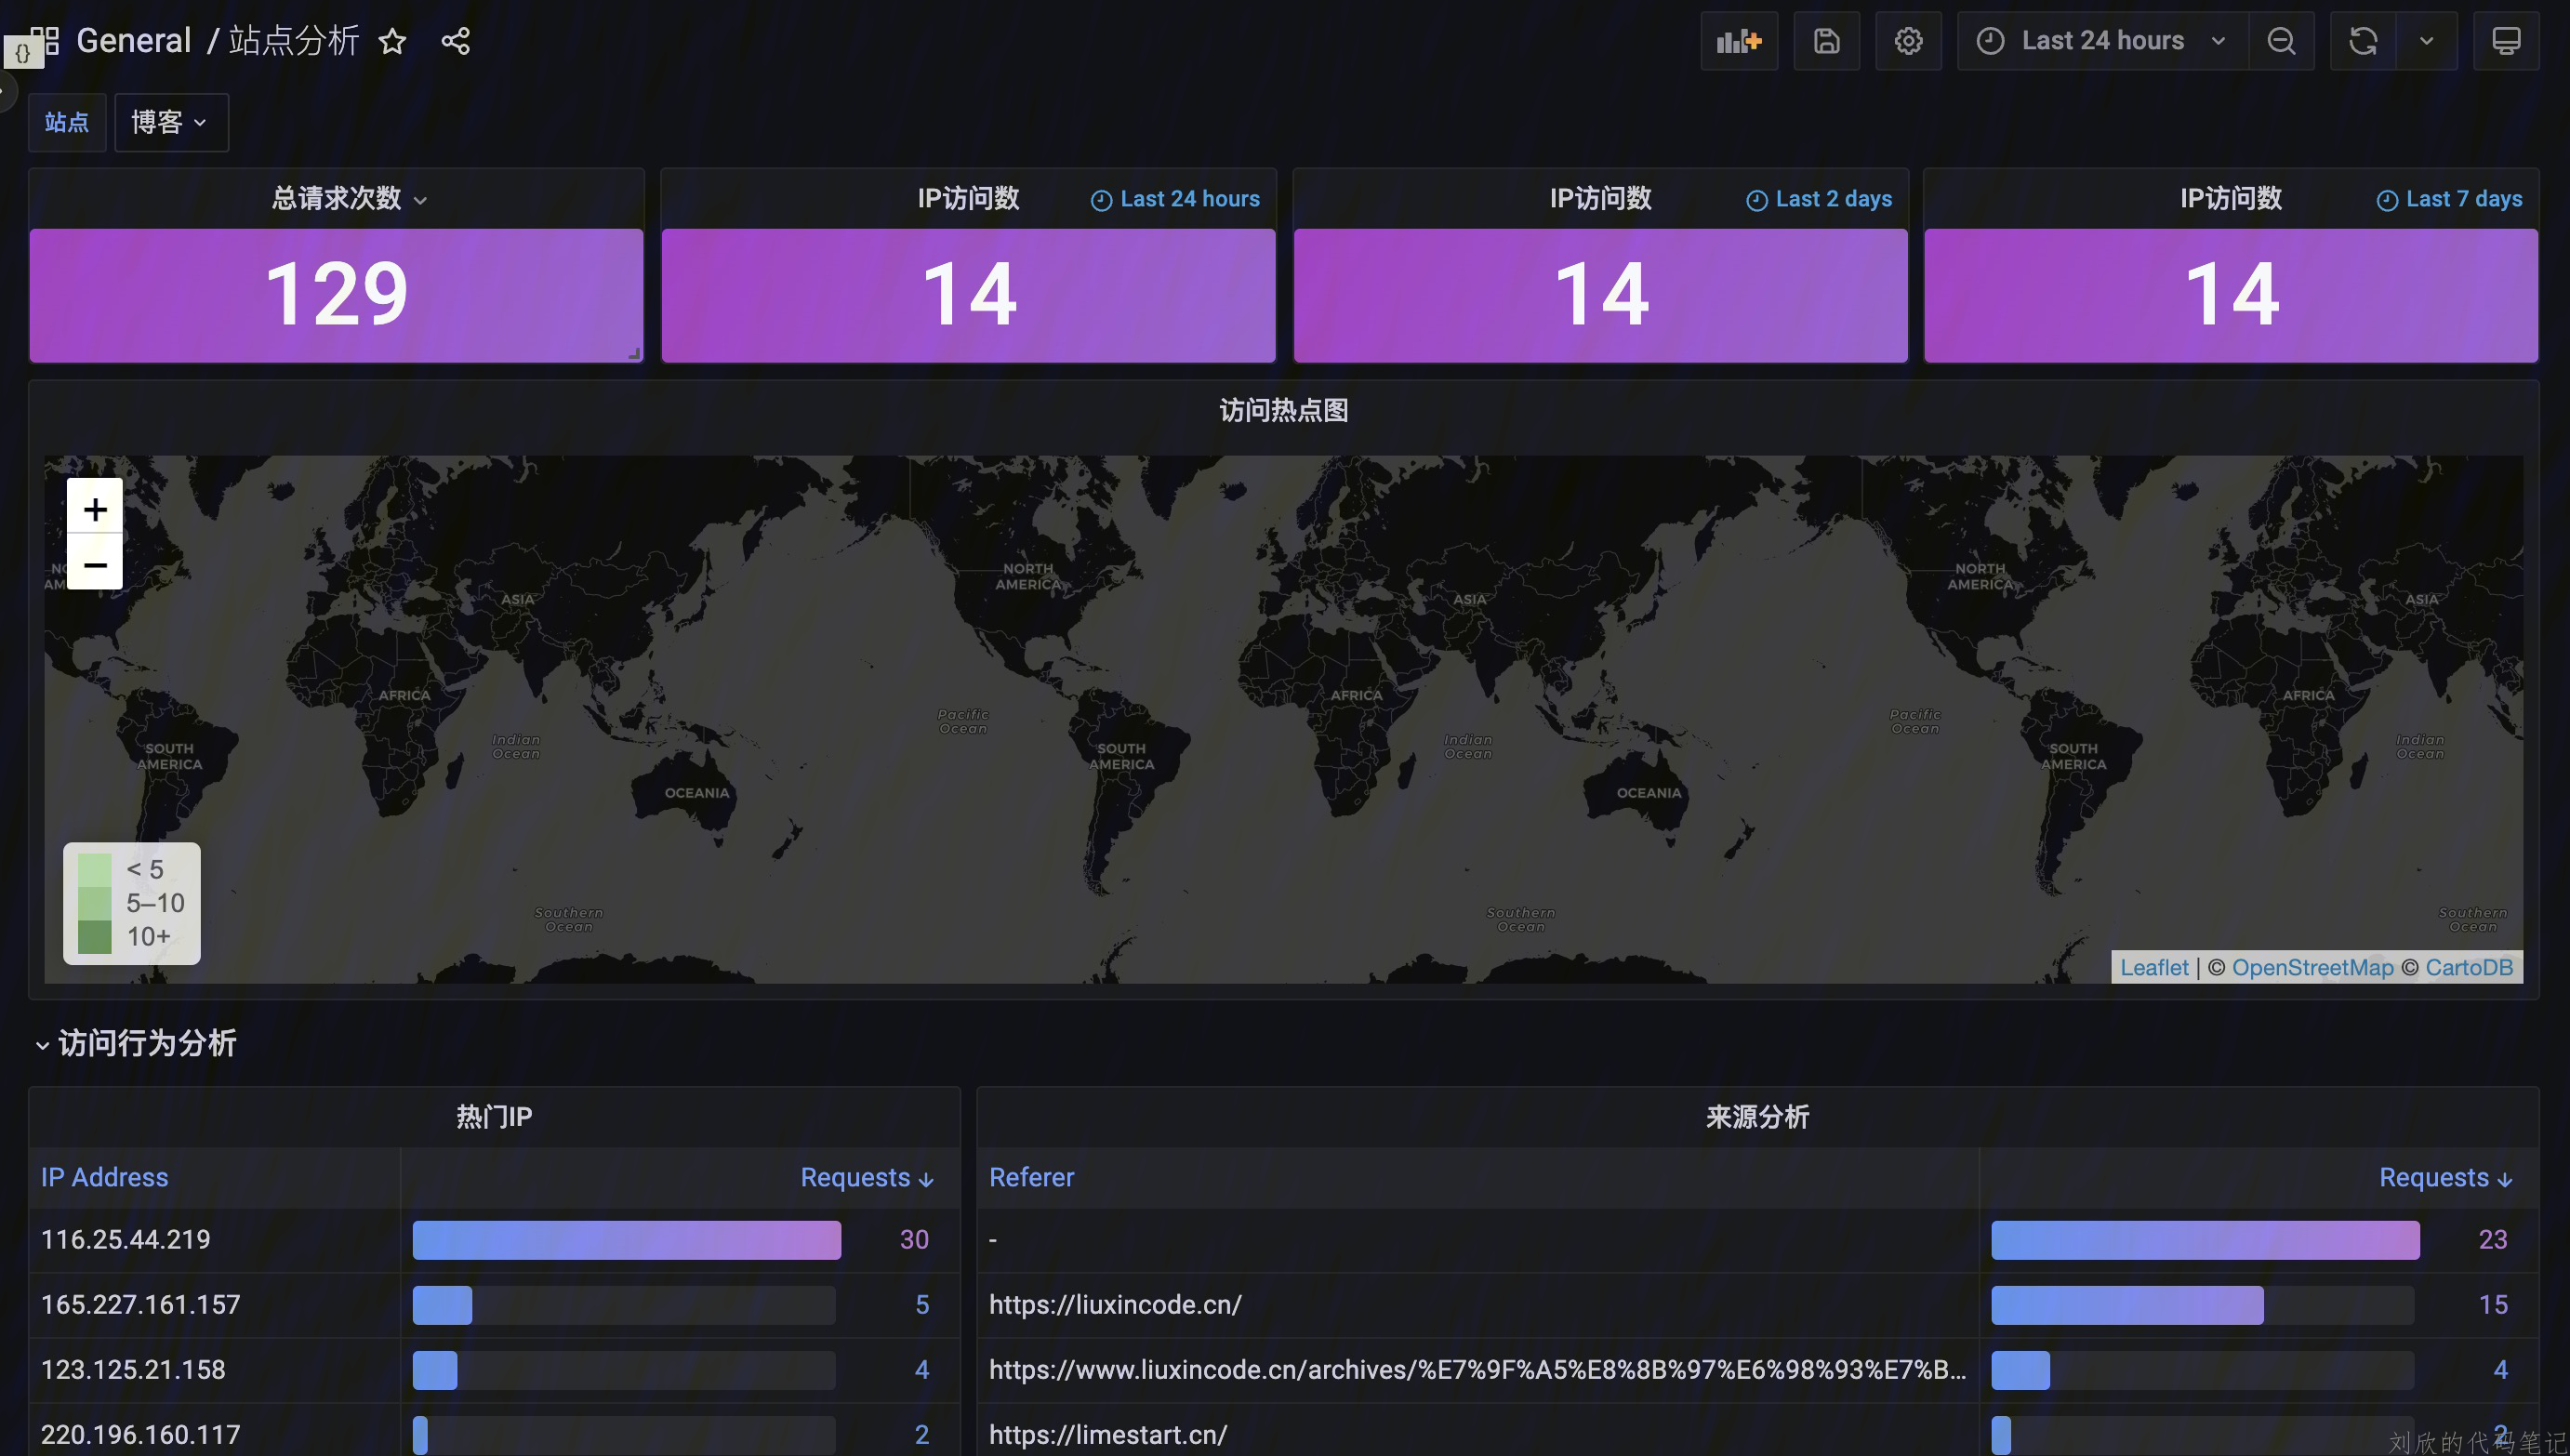

前言
最近在群里看到网友在使用 宝塔的网站监控,大致的效果类似于下面这样
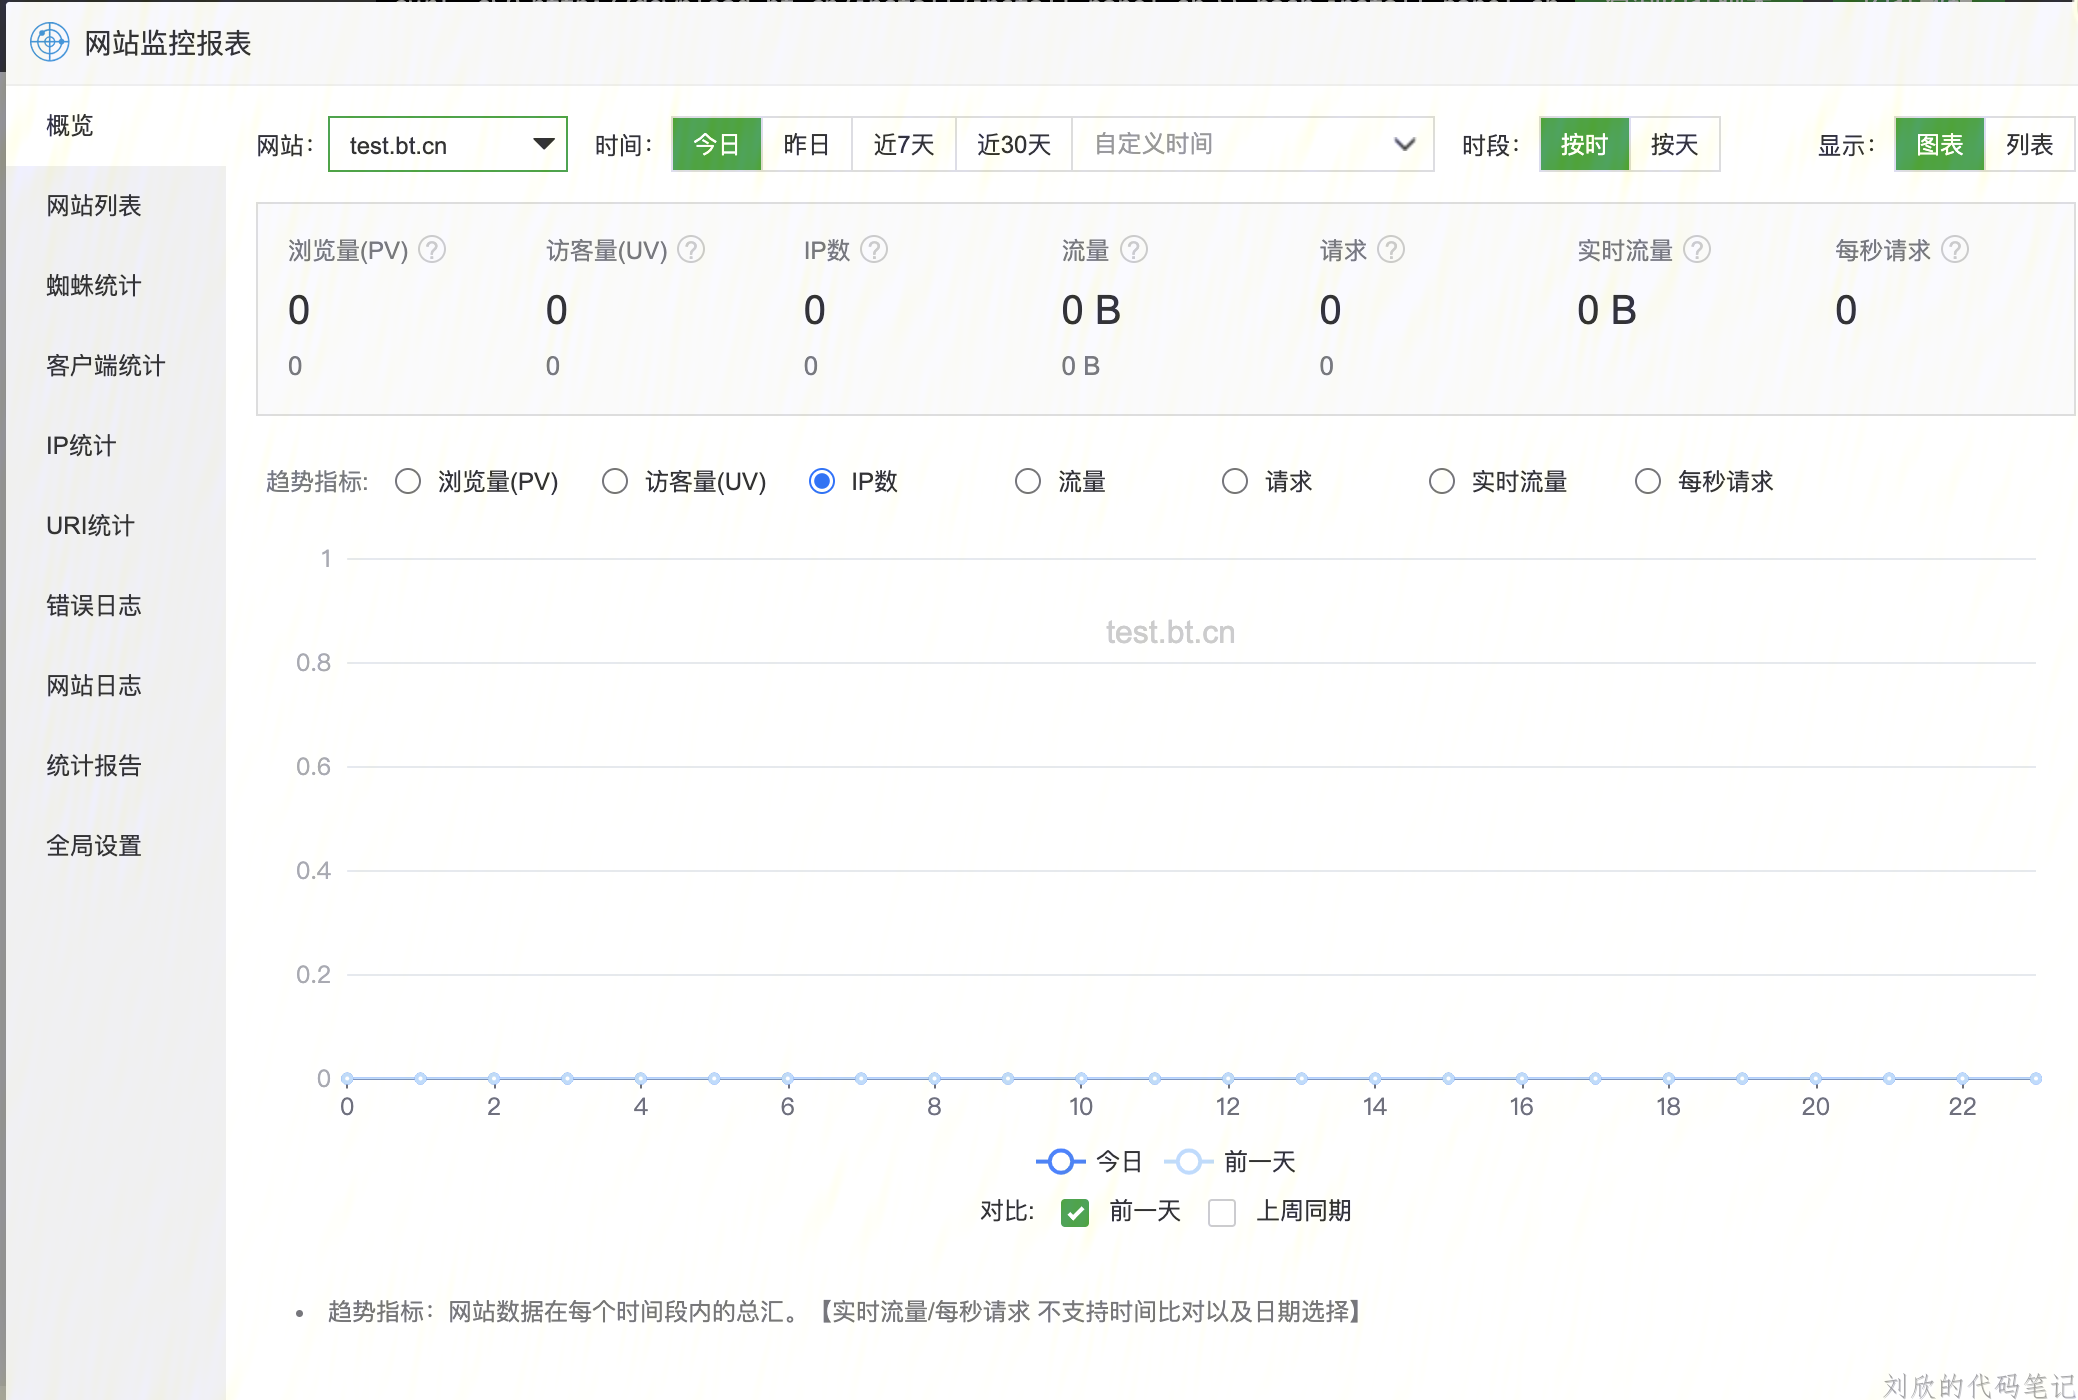
由于博主搭建的站点比较多,同时也想统计一下每个站点的访问情况,就像自己搭建一个站点监控面板。大致思路呢也很简单,就是搭建一个日志系统分析nginx日志,然后查询数据进行展示。
之前在公司有搭建过ELK,但是ELK比较重,不适合博主这类个人小站。因此,博主选择了使用loki来做日志系统,再使用Grafana进行可视化展示。
设置Nginx日志格式
因为Nginx默认的日志格式(如下)信息比较少,而且格式不方便我们去查询关键数据(如果你对你的正则十分自信,那也可以~)
180.101.245.247 - - [20/Nov/2022:23:49:01 +0000] "GET / HTTP/1.1" 200 92 "-" "Mozilla/5.0 (iPhone; CPU iPhone os 15_4 like Mac OS X) AppleWebKit/605.1.15 (KHTML, like Gecko) Version/15.4 Mobile/11D257 Safari/604.1"
因此,我们首先将Nginx的日志更换成json格式的,并将部分关键数据输出。
编辑 nginx.conf 配置文件,将原有的 log_format 更换成下面的格式配置,并将其命名为main:
log_format main '{'
                    '"msec": "$msec", ' # request unixtime in seconds with a milliseconds resolution
                    '"connection": "$connection", ' # connection serial number
                    '"connection_requests": "$connection_requests", ' # number of requests made in connection
                    '"pid": "$pid", ' # process pid
                    '"request_id": "$request_id", ' # the unique request id
                    '"request_length": "$request_length", ' # request length (including headers and body)
                    '"remote_addr": "$remote_addr", ' # client IP
                    '"remote_user": "$remote_user", ' # client HTTP username
                    '"remote_port": "$remote_port", ' # client port
                    '"time_local": "$time_local", '
                    '"time_iso8601": "$time_iso8601", ' # local time in the ISO 8601 standard format
                    '"request": "$request", ' # full path no arguments if the request
                    '"request_uri": "$request_uri", ' # full path and arguments if the request
                    '"args": "$args", ' # args
                    '"status": "$status", ' # response status code
                    '"body_bytes_sent": "$body_bytes_sent", ' # the number of body bytes exclude headers sent to a client
                    '"bytes_sent": "$bytes_sent", ' # the number of bytes sent to a client
                    '"http_referer": "$http_referer", ' # HTTP referer
                    '"http_user_agent": "$http_user_agent", ' # user agent
                    '"http_x_forwarded_for": "$http_x_forwarded_for", ' # http_x_forwarded_for
                    '"http_host": "$http_host", ' # the request Host: header
                    '"server_name": "$server_name", ' # the name of the vhost serving the request
                    '"request_time": "$request_time", ' # request processing time in seconds with msec resolution
                    '"upstream": "$upstream_addr", ' # upstream backend server for proxied requests
                    '"upstream_connect_time": "$upstream_connect_time", ' # upstream handshake time incl. TLS
                    '"upstream_header_time": "$upstream_header_time", ' # time spent receiving upstream headers
                    '"upstream_response_time": "$upstream_response_time", ' # time spend receiving upstream body
                    '"upstream_response_length": "$upstream_response_length", ' # upstream response length
                    '"upstream_cache_status": "$upstream_cache_status", ' # cache HIT/MISS where applicable
                    '"ssl_protocol": "$ssl_protocol", ' # TLS protocol
                    '"ssl_cipher": "$ssl_cipher", ' # TLS cipher
                    '"scheme": "$scheme", ' # http or https
                    '"request_method": "$request_method", ' # request method
                    '"server_protocol": "$server_protocol", ' # request protocol, like HTTP/1.1 or HTTP/2.0
                    '"pipe": "$pipe", ' # "p" if request was pipelined, "." otherwise
                    '"gzip_ratio": "$gzip_ratio", '
                    '"http_cf_ray": "$http_cf_ray"'
                '}';
我们接着去各个站点,在原有的日志输出下,指定使用main的命名格式:
access_log /log/liuxincode.cn/access.log main;
安装loki、promtail、Grafana
我们直接选择Docker安装
创建 loki、promtail 工作目录
分别在下面两个目录下创建config.yml配置文件
# promtail 配置
server:
  http_listen_port: 9080
  grpc_listen_port: 0
positions:
  filename: /tmp/positions.yaml
clients:
  - url: http://172.17.0.1:3100/loki/api/v1/push # 我这里用的是`docker`网关地址,也是宿主机在`Docker`网段的地址
scrape_configs:
  - job_name: system
    static_configs:
      - targets:
          - localhost
        labels:
          job: varlogs
          __path__: /var/log/*/*.log
#loki配置
auth_enabled: false

server:
  http_listen_port: 3100

common:
  path_prefix: /loki
  storage:
    filesystem:
      chunks_directory: /loki/chunks
      rules_directory: /loki/rules
  replication_factor: 1
  ring:
    instance_addr: 127.0.0.1
    kvstore:
      store: inmemory

schema_config:
  configs:
    - from: 2020-10-24
      store: boltdb-shipper
      object_store: filesystem
      schema: v11
      index:
        prefix: index_
        period: 24h

table_manager:
  retention_deletes_enabled: true
  retention_period: 480h

ruler:
  alertmanager_url: http://localhost:9093
创建docker-compose.yml文件
version: "3"

services:
  loki:
    image: grafana/loki:latest
    volumes:
      - /app_home/loki/data/:/etc/loki/
    ports:
      - "3100:3100"
    command: -config.file=/etc/loki/config.yaml
    networks:
      - loki

  promtail:
    image: grafana/promtail:latest
    volumes:
      - /app_home/promtail/logs/:/var/log/  #这里的/app_home/promtail/logs/为nginx日志目录,我是直接ln -s 软链接nginx日志过来
      - /app_home/promtail/data/:/etc/promtail/
    command: -config.file=/etc/promtail/config.yaml
    networks:
      - loki

  grafana:
    image: grafana/grafana:latest
    ports:
      - "3000:3000"
运行启动三个应用:docker-compose up -d
配置面板数据
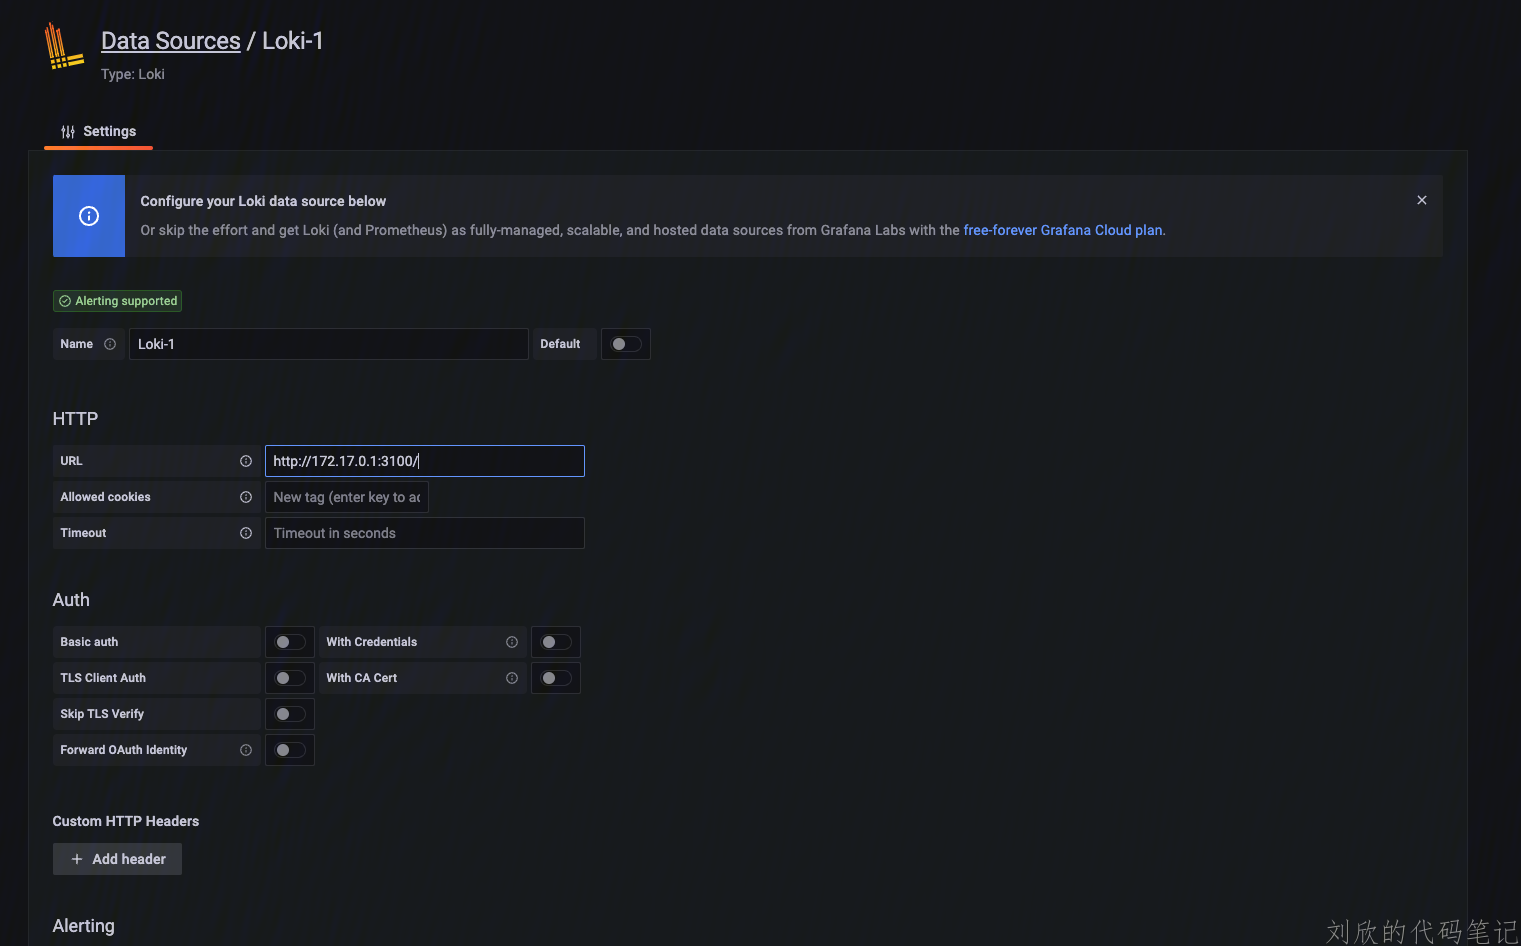
打开ip:3000,进入Grafana页面,登录。
点击左下角的设置,添加一个loki数据源,填写地址:
新建一个面板,开始进行我们的面板配置。当然~也可以去官方网站找大佬们已经配置好的面板
附:Nginx 日志语法
$remote_addr       客户端地址
$remote_user       客户端用户名称
$time_local        访问时间和时区
$request           请求的URI和HTTP协议
$status            HTTP请求状态
$body_bytes_sent   发送给客户端文件内容大小
$http_referer      url跳转来源
$http_user_agent   用户终端浏览器等信息
$http_host         请求地址,即浏览器中你输入的地址(IP或域名)
$request_time      处理请求的总时间,包含了用户数据接收时间
$upstream_response_time 建立连接和从上游服务器接收响应主体的最后一个字节之间的时间
$upstream_connect_time  花费在与上游服务器建立连接上的时间
$upstream_header_time   建立连接和从上游服务器接收响应头的第一个字节之间的时间